Run an experiment with cumba_experiment()
Source:vignettes/cumba-experiment.Rmd
cumba-experiment.RmdWhen to use cumba_experiment()
Use cumba_experiment() when you have observed
experiments with their actual irrigation schedule and you want
CUMBA to reproduce them. This is the function used during model
calibration against yield/Brix observations.
The companion function cumba_scenario() is meant for
what-if deficit-irrigation studies, where irrigation is
triggered automatically based on phase-specific water-stress
thresholds.
Required inputs
| Argument | Description |
|---|---|
weather |
Daily data frame: Site, Tx,
Tn, P, DATE, Lat (if
estimateRad = TRUE) or Rad
|
param |
Named list-of-lists (e.g. cumbaParameters) or plain
numeric data frame |
irrigation_df |
Data frame with ID, Site,
YEAR, DATE, WVOL (mm) |
estimateRad |
TRUE → Hargreaves–Samani from Lat;
FALSE → use Rad column |
estimateET0 |
TRUE → FAO-56 Penman–Monteith; FALSE → use
ET0 column |
irrigationEfficiency |
Fraction of applied water reaching the root zone (default
0.9) |
fullOut |
FALSE → short output; TRUE → all internal
state variables |
A complete walkthrough on tomatoFoggia
library(cumba)
library(dplyr)
library(ggplot2)

data(tomatoFoggia)
data(cumbaParameters)

out <- cumba_experiment(
  weather              = tomatoFoggia$weather,
  param                = cumbaParameters,
  irrigation_df        = tomatoFoggia$irrigation,
  estimateRad          = TRUE,
  estimateET0          = TRUE,
  irrigationEfficiency = 0.9,
  fullOut              = FALSE
)

head(out)
#>     site year experiment doy p irrigation              stage      swc yield
#> 1 Foggia 2005          1 118 0       27.9 post-transplanting 30.00000     0
#> 2 Foggia 2005          1 119 0        0.0 post-transplanting 29.78431     0
#> 3 Foggia 2005          1 120 0        0.0 post-transplanting 29.60447     0
#> 4 Foggia 2005          1 121 0        0.0 post-transplanting 29.40442     0
#> 5 Foggia 2005          1 122 0        0.0 post-transplanting 29.28403     0
#> 6 Foggia 2005          1 123 0        0.0 post-transplanting 29.23520     0
#>   brix
#> 1    0
#> 2    0
#> 3    0
#> 4    0
#> 5    0
#> 6    0
Harvest-day values
Each simulation ends when the crop cycle is complete. The last row for each (site × year × experiment) combination carries the harvest-day yield and Brix:
harvest <- out |>
  group_by(site, year, experiment) |>
  slice_tail(n = 1) |>
  ungroup() |>
  select(site, year, experiment, yield, brix)

harvest
#> # A tibble: 32 × 5
#>    site    year experiment yield  brix
#>    <chr>  <dbl>      <dbl> <dbl> <dbl>
#>  1 Foggia  2005          1  41.2  6.01
#>  2 Foggia  2005          2  82.4  5.35
#>  3 Foggia  2005          3 108.   5.07
#>  4 Foggia  2005          4  64.7  5.29
#>  5 Foggia  2005          5  70.5  5.15
#>  6 Foggia  2005          6  94.9  5.09
#>  7 Foggia  2006          7  35.2  5.98
#>  8 Foggia  2006          8  65.6  5.24
#>  9 Foggia  2006          9  81.9  5.33
#> 10 Foggia  2006         10  55.8  5.23
#> # ℹ 22 more rows
Compare with observations
tomatoFoggia$production contains observed
yield_ref (t ha⁻¹) and brix_ref (°Brix). The
yield column in the short output is in q
ha⁻¹, so divide by 10 to convert to t ha⁻¹:
production <- tomatoFoggia$production

cmp <- harvest |>
  mutate(experiment = as.integer(experiment)) |>
  inner_join(production, by = c("experiment" = "ID")) |>
  mutate(yield_t = yield / 10)

ggplot(cmp, aes(yield_ref, yield_t)) +
  geom_abline(slope = 1, intercept = 0, linetype = 2, colour = "grey50") +
  geom_smooth(method = "lm", se = TRUE, colour = "#d6604d",
              fill = "#f4a582", linewidth = 0.8) +
  geom_point(size = 3, colour = "#2166ac", alpha = 0.85) +
  labs(x = "Observed yield (t ha⁻¹)",
       y = "Simulated yield (t ha⁻¹)",
       title = "CUMBA — yield validation") +
  theme_bw(base_size = 12)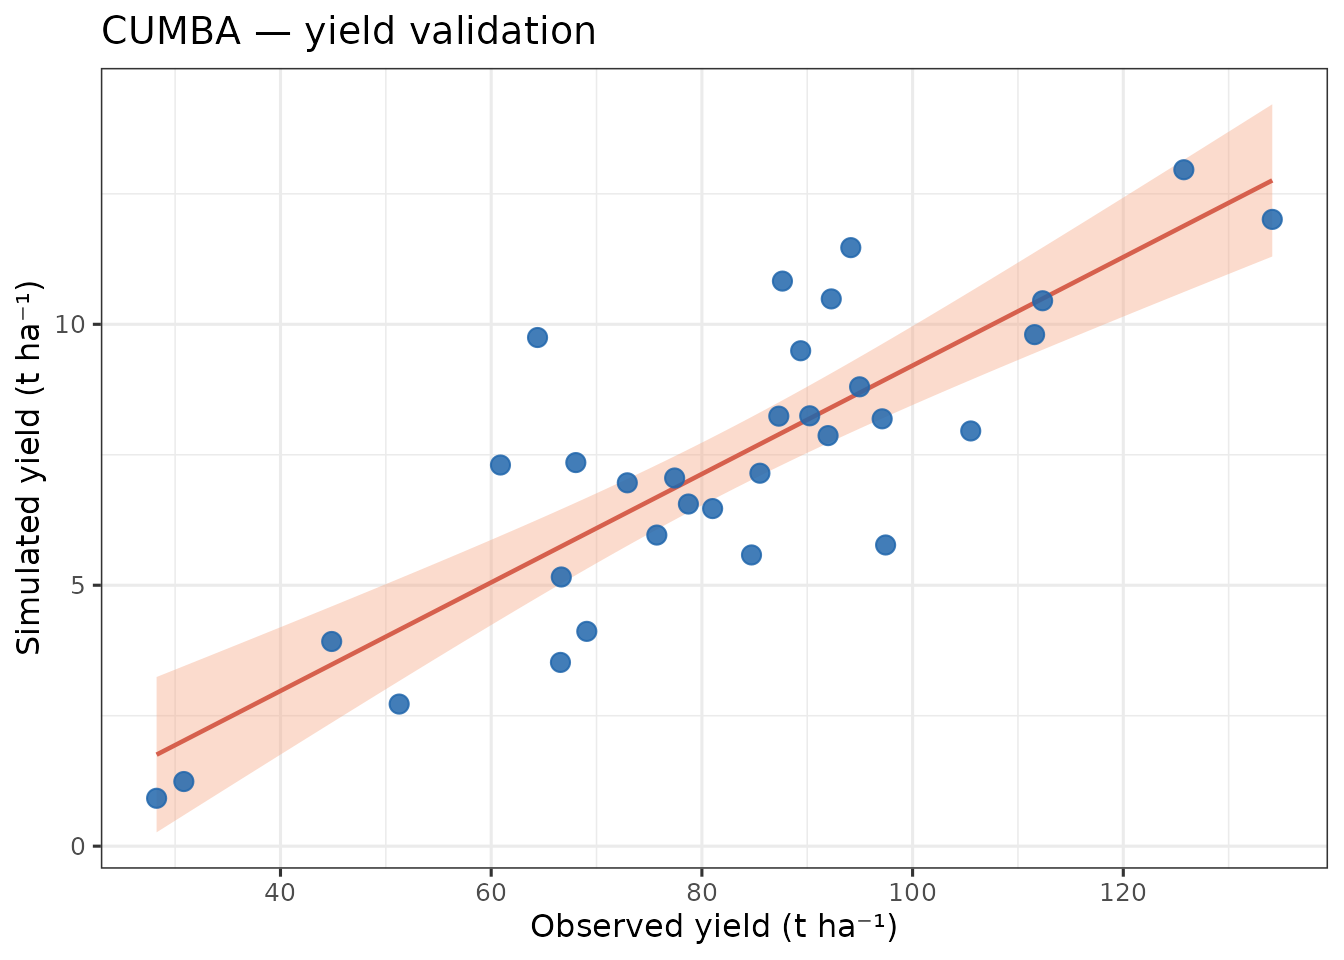
ggplot(cmp, aes(brix_ref, brix)) +
  geom_abline(slope = 1, intercept = 0, linetype = 2, colour = "grey50") +
  geom_smooth(method = "lm", se = TRUE, colour = "#4dac26",
              fill = "#b8e186", linewidth = 0.8) +
  geom_point(size = 3, colour = "#762a83", alpha = 0.85) +
  labs(x = "Observed Brix (°Brix)",
       y = "Simulated Brix (°Brix)",
       title = "CUMBA — Brix validation") +
  theme_bw(base_size = 12)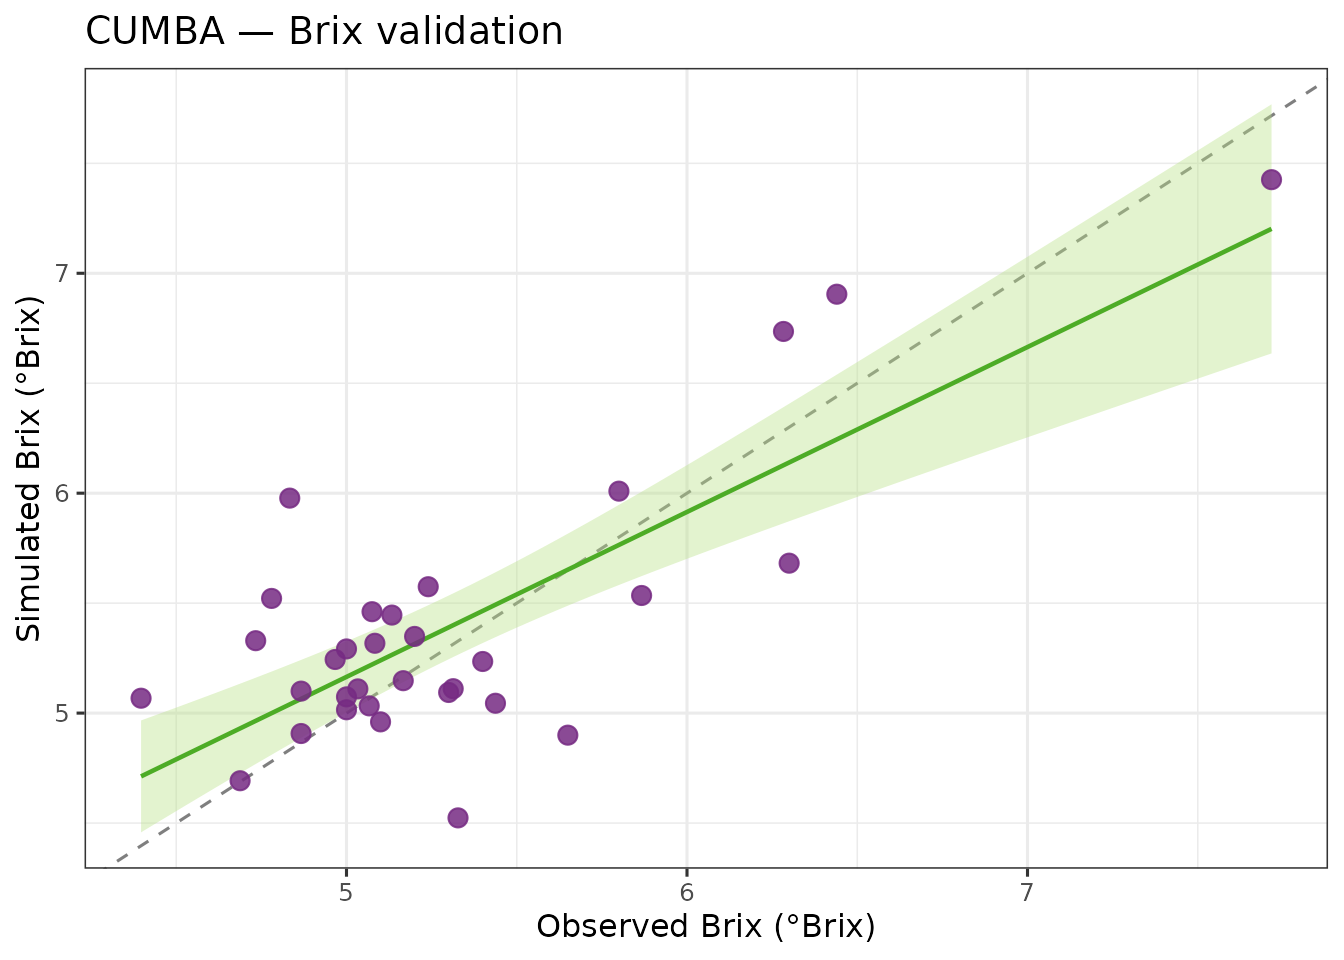
Full output for diagnostics
Pass fullOut = TRUE to access every internal state
variable (GDD, Kc, soil water per layer, carbon pools, flowering state,
etc.):
out_full <- cumba_experiment(
  weather              = tomatoFoggia$weather,
  param                = cumbaParameters,
  irrigation_df        = tomatoFoggia$irrigation,
  estimateRad          = TRUE,
  estimateET0          = TRUE,
  fullOut              = TRUE
)

names(out_full)
Notes
- Cardinal temperatures in
parammust satisfyTmax > Topt > Tbaseand soil parameters must satisfyFieldCapacity > WiltingPoint; otherwise the function stops with a descriptive error. - Run-time scales linearly with the number of (site × year × ID) combinations: each is simulated independently day-by-day.
- The
experimentcolumn in the output is a character; convert withas.integer()before joining with integer-keyed observation tables.